In this blog post, I want to show you how we’ve set up a health dashboard for the integration landscape of a client in Rotterdam. The dashboard shows the health of some important servers in our production landscape and the health of some Spring Boot apps. Also, some extra information is displayed, like the version of the app and its uptime. Once the pandemic is over, you can display this dashboard on a big OLED screen in the office so everybody can see how good (or bad) you’re doing. Also, users browsing to the dashboard URL can also click on the blocks to get more information on a detailed page.
The end result looks like this:
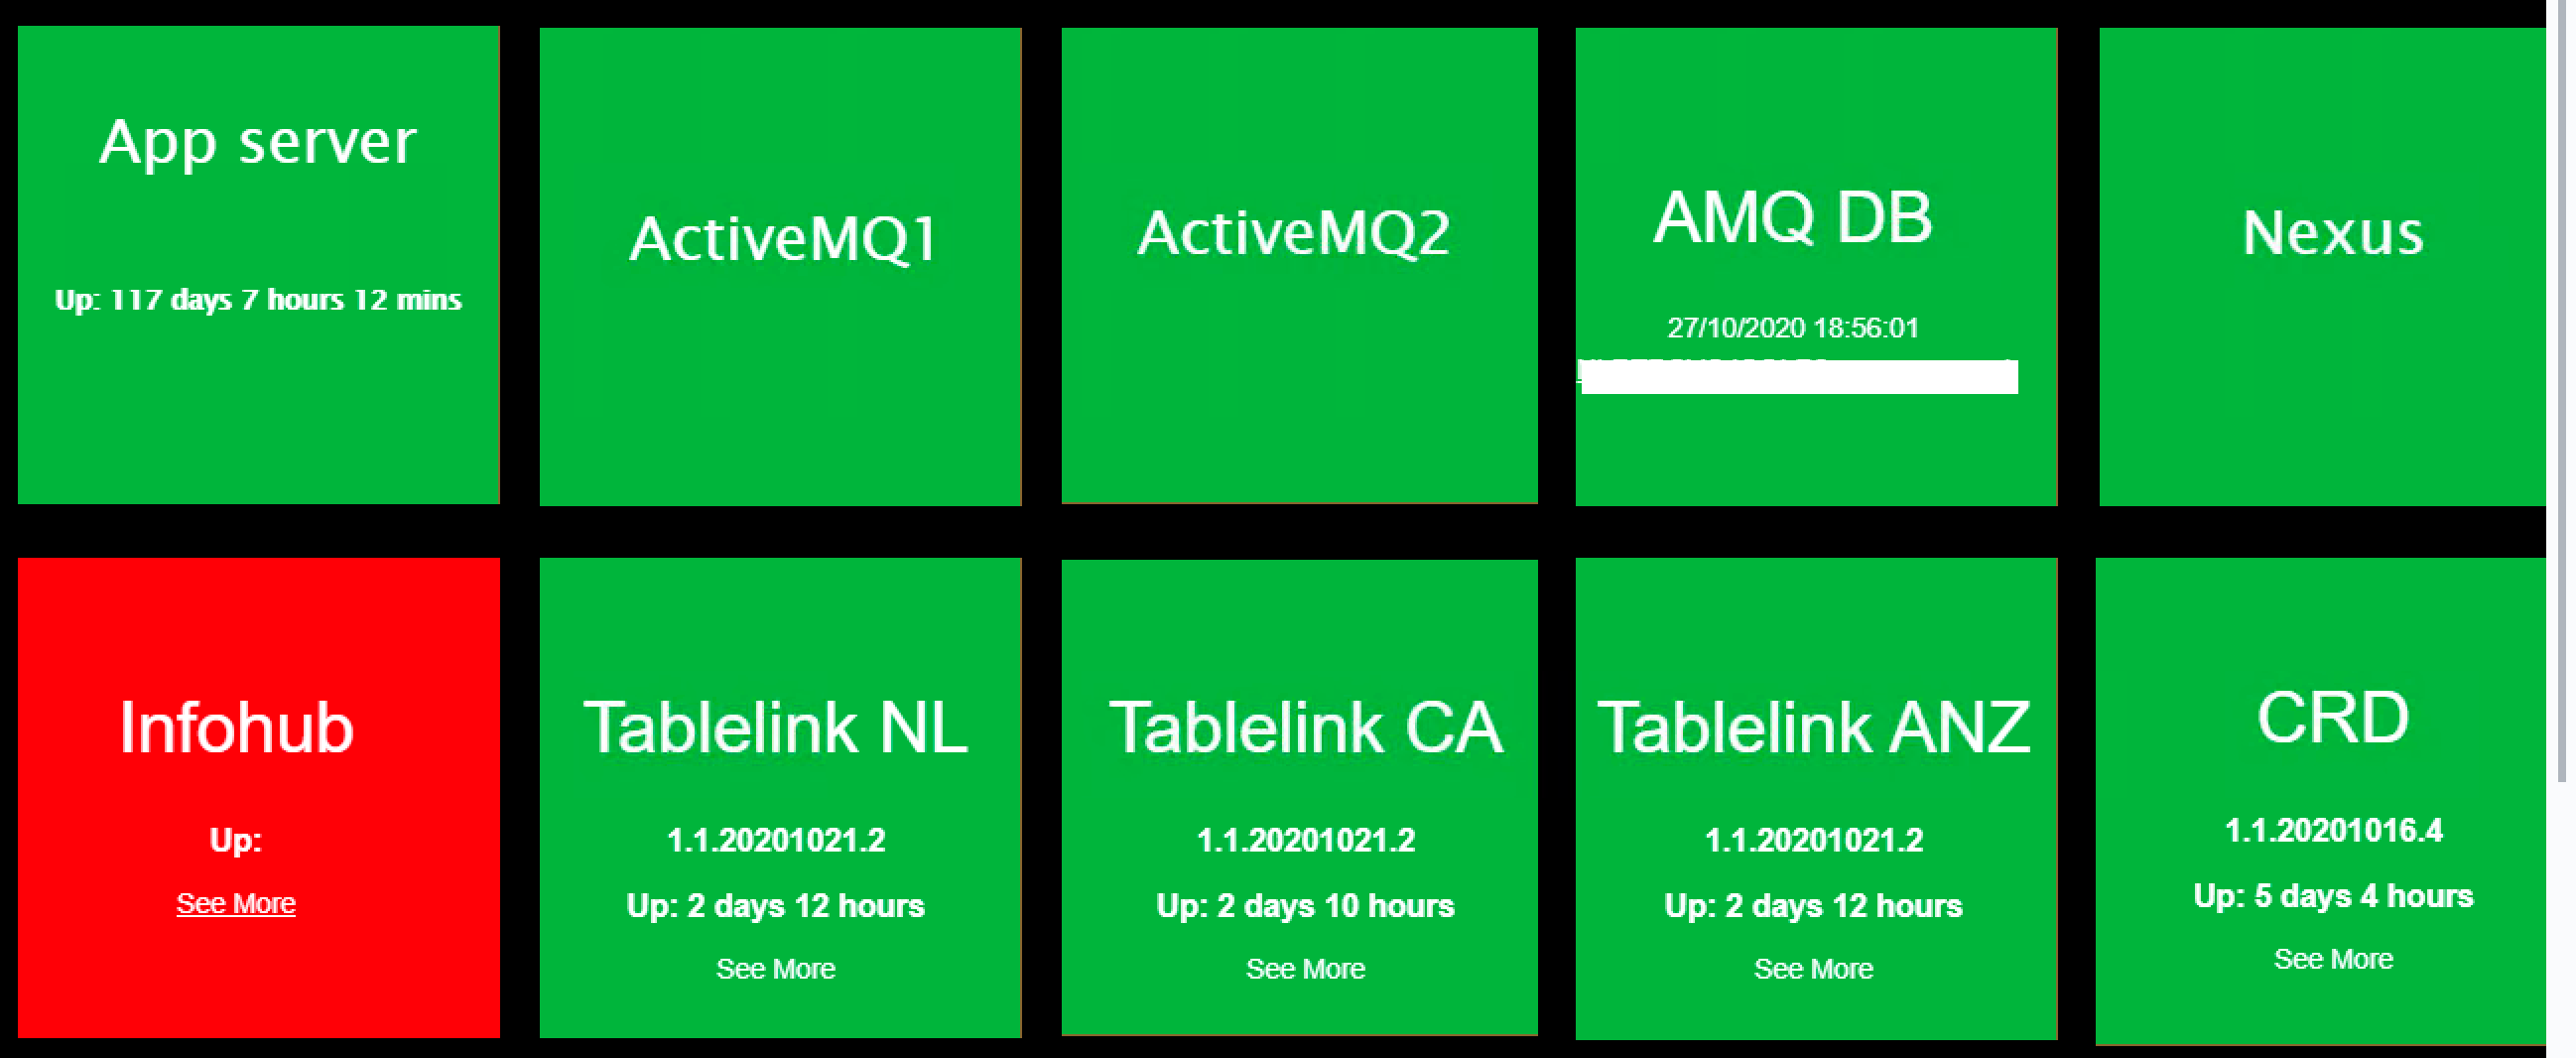
Yeah, I know: I’m a developer, not a designer 😉
Each square consists of:
- An Image / Image reveal: showing a green or red block (image) based on the status of a monitored item (up or down). This will use data from heartbeat
- Markdown text with static and dynamic text (showing version and uptime of a monitored item). This will use data from metricbeat
To get the health- and version data into Elasticsearch / Kibana , we must first setup 2 beats the Elastic stack provides: heartbeat and metricbeat. We’re using Elastic 7.9 here but i think the description below works for slightly older and newer versions also.
Setting up Heartbeat
Heartbeat is a lightweight shipper for uptime monitoring. You can configure several types of monitoring like ICMP (the so-called ping), TCP, or HTTP. See the quick start for instructions on how to install heartbeat on your system.
Note: if you have setup heartbeat, you can also have a look at the Uptime dashboard included in Kibana.
Heartbeat config for a Spring boot app
Create a monitor config and put in the monitors.d folder, e.g. /etc/heartbeat/monitors.d/cis-infohub-http.yml
- type: http
  id: cis-infohub
  name: CIS Infohub
  enabled: true
  schedule: '@every 30s'
  hosts: ["yourapphost:12000/management/health"]
  ipv4: true
  ipv6: false
  mode: all
  method: "GET"
  check.response:
    status: 200
    json:
    - description: Status must be UP
      condition:
        equals:
          status: UP
This config will make sure your app living @ <yourapphost> port 12000 is polled every 30 seconds by sending an HTTP request to the Spring Boot actuator health endpoint. The response is checked for the JSON string “UP” and the results will be stored in the heartbeat-* index in elasticsearch (by default). We will use the status in a query later (see below)
Heartbeat config for a server
To check if a server is alive and kicking, a ping request can be sent to it using the ICMP protocol. Store the monitor definition in the monitors.d folder, e.g. /etc/heartbeat/monitors.d/cis-appserver-icmp.yml
- type: icmp # monitor type `icmp` (requires root) uses ICMP Echo Request to ping
  # ID used to uniquely identify this monitor in elasticsearch even if the config changes
  id:  yourappserverid

  # Human readable display name for this service in Uptime UI and elsewhere
  name: Our App Server

  # Enable/Disable monitor
  enabled: true

  # Configure task schedule using cron-like syntax
  schedule: '@every 60s'

  # List of hosts to ping
  hosts: ["yourappserver"]

  # Configure IP protocol types to ping on if hostnames are configured.
  # Ping all resolvable IPs if `mode` is `all`, or only one IP if `mode` is `any`.
  ipv4: true
  ipv6: true
  mode: any

  # Total running time per ping test.
  timeout: 20s

  # Waiting duration until another ICMP Echo Request is emitted.
  wait: 5s
This monitor will ping the server(s) specified in the hosts field every minute. The results will also be stored in the heartbeat-* index in elasticsearch (by default).
Metricbeat
Metricbeat is a lightweight shipper for metrics. It comes with a lot of modules like ‘system‘ for shipping CPU, memory, network, uptime data, and more, ‘http‘ for querying HTTP endpoints, ‘Jolokia’ for querying queue statistics, etc If you need to install metricbeat on your system, just follow the quick start guide.
Metricbeat config for a Spring boot app
We’ll use the actuator info endpoint to determine the uptime of, for example, our camel context. The metricbeat HTTP module gives us the possibility to fetch and return data from an HTTP endpoint. Since the info endpoint returns JSON, we use the JSON metric set. Put the metricbeat monitor in the modules.d folder, e.g. /etc/metricbeat/modules.d/cis-infohub-http.yml
- module: http
  enabled: true
  metricsets:
    - json
  period: 30s
  hosts: ["yourappserver:12000/management/info"]
  namespace: "cis"
  fields:
    metric_id: cis-infohub
When the metrics are retrieved, the JSON data will be stored under the given module name + specified namespace. For example:
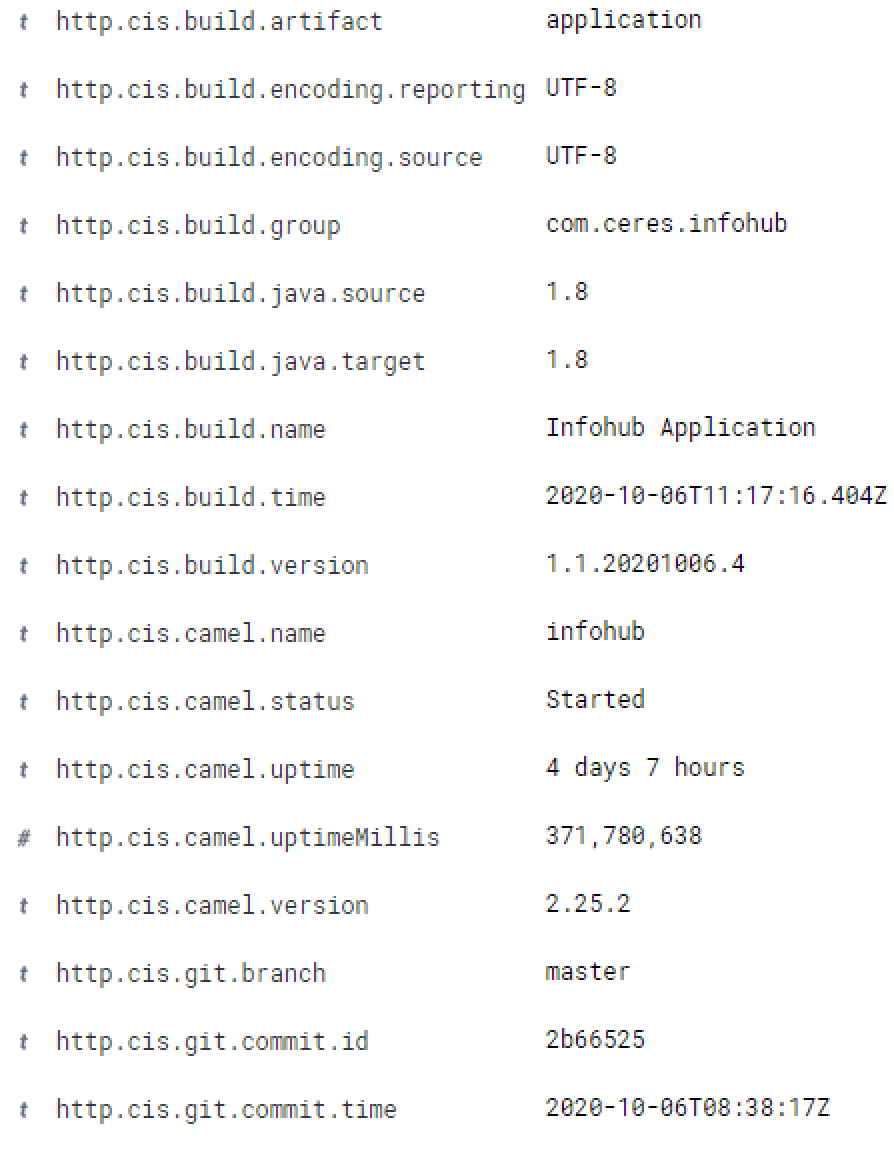
We’re interested in the version of our app and the uptime as we will see later.
Metricbeat config for a server
- module: system
  period: 15m
  metricsets:
    - uptime
Put this metricbeat monitor in the modules.d folder on the system you are monitoring, e.g. /etc/metricbeat/modules.d/cis-server-uptime.yml
The system module is just one of the many modules you can use. See the Elastic module page for more info. Also, the ‘uptime’ metric set of the system module is just one of the many sets you can use. See the Elastic system module page for more info.
Creating the Kibana Canvas
Now, we will finally use all those gorgeous data we collected in the previous steps. You can use the gathered data in Kibana Dashboards, but also in a Powerpointy like sheet thingie called Kibana Canvas. You can create multi-paged, CSS styled, pixel perfect presentations like the one shown here, at least: that’s what they say.
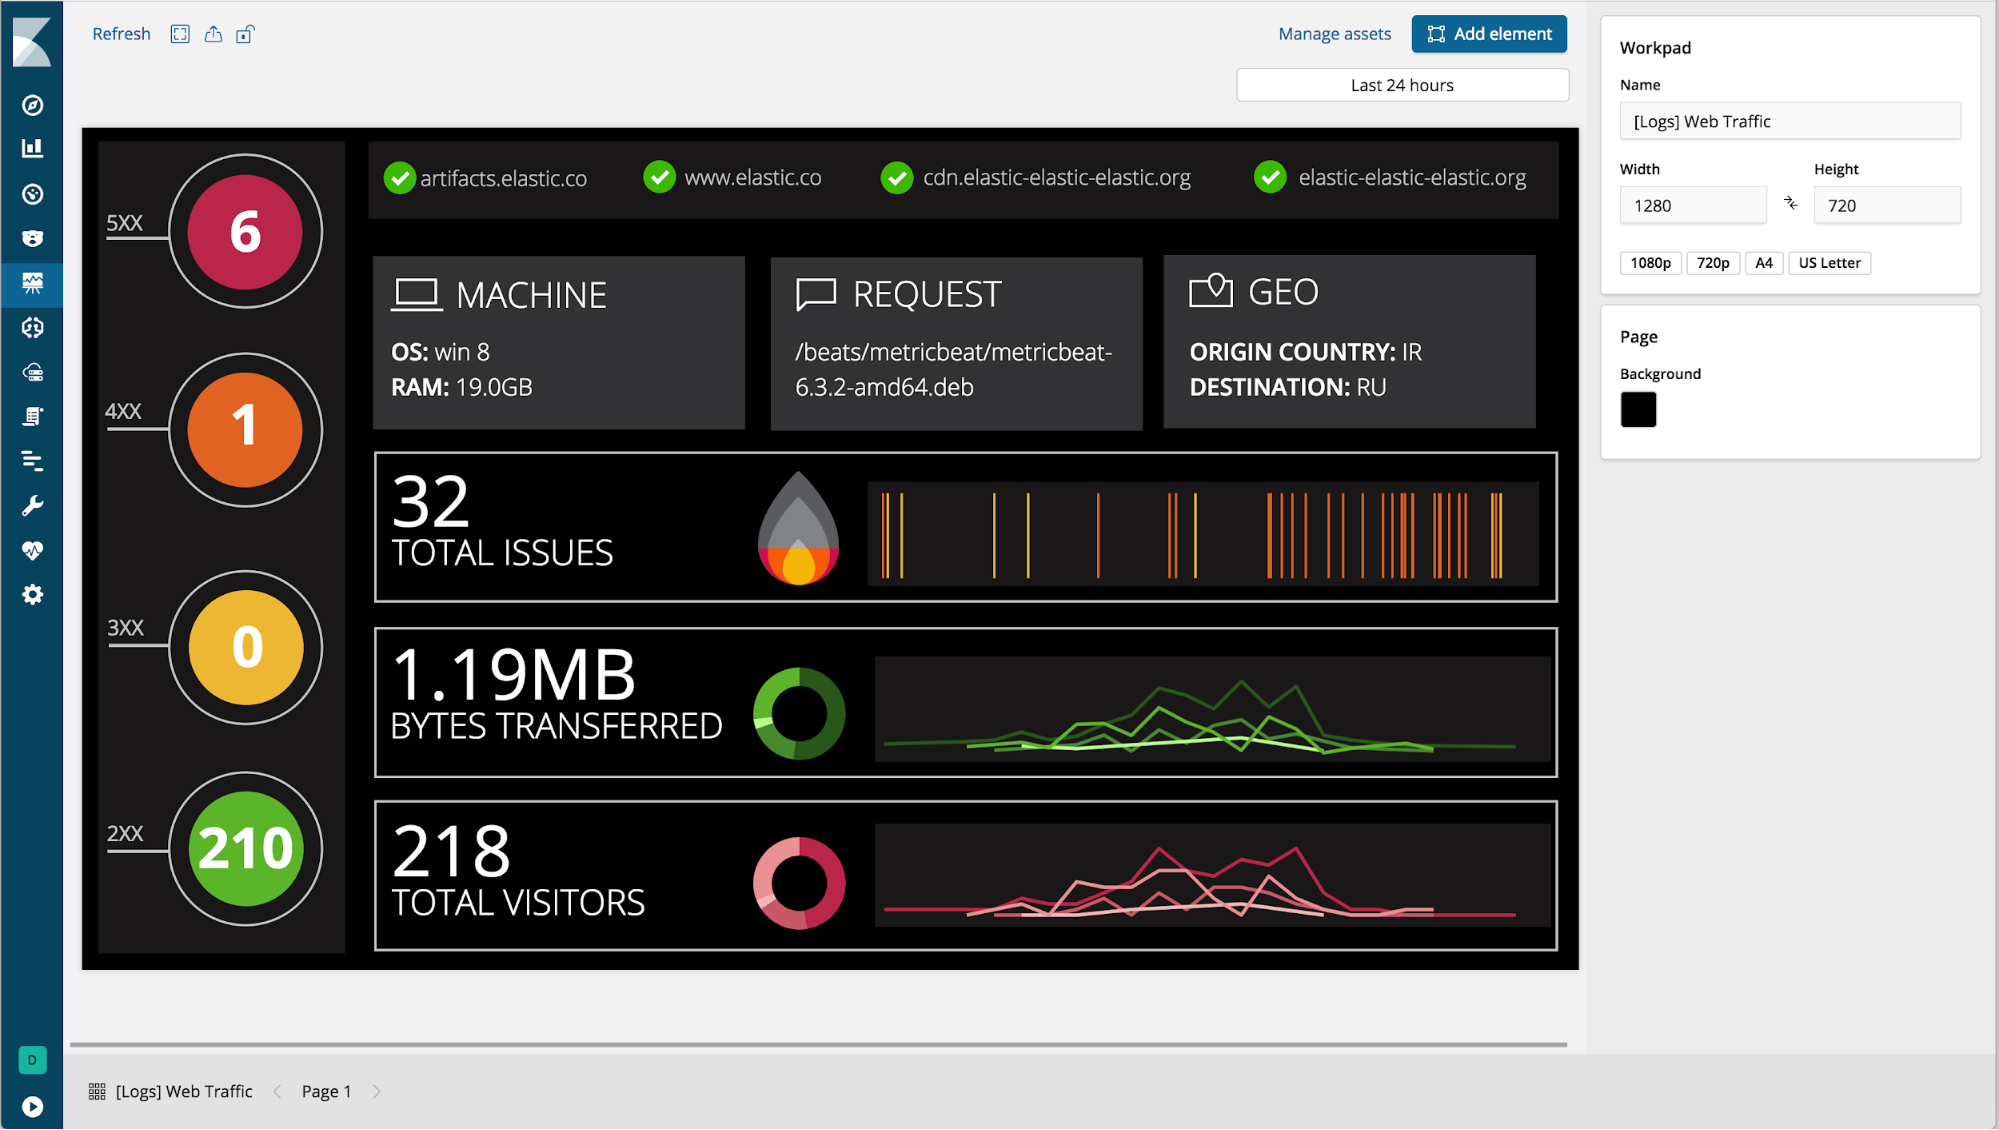
Click on left menu in Kibana / Canvas. Create a workpad. A workpad is a workspace for your presentations. A workpad consists of one or more pages with elements.
Adding the green/red box (image)
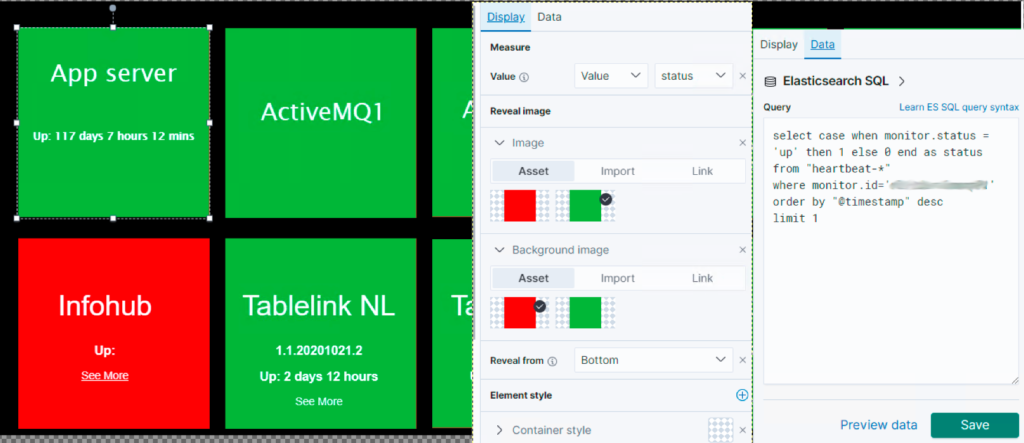
- Add element: Image / Image Reveal.
- Click on the ‘+’ on the right (Reveal image) and select ‘Background image’. Now you can select 2 images representing the up and down state.
You can use any image you want, say a green traffic light image for the foreground image, and a red traffic light image for the background. To switch between the images or better: reveal the correct image, we must first go to the Data tab and configure it to use our heartbeat data. - Go to the Data tab, select Demo data and replace it with Elasticsearch SQL (or another way if you don’t like SQL; then you on your own ;-))
The point is to come up with a value between 0 and 1 (100%) to reveal the image. Since we only need to completely hide or reveal the image, the values 0 or 1 will suffice. 1 is up (green), 0 is down (red). - Preview the data end if you’re happy, Save!
- Go to the Display tab again, and set the value to the field containing the 0 or 1.
In one picture:
Adding the uptime / version info
- Add element / Text
- You can use data from a query in the markup text. Great stuff!
- Example of uptime info:
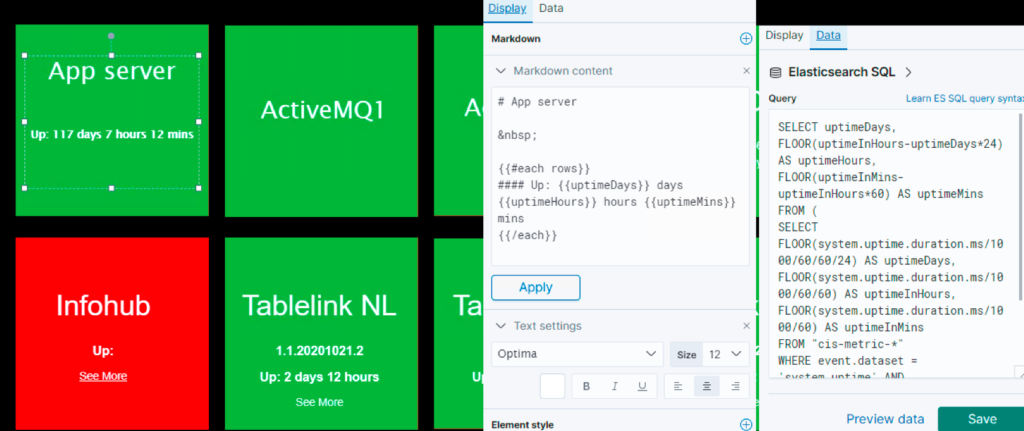
The complete SQL is added below
ESQL & MD FTW !
ESQL for determining the up or down status
select case when monitor.status = 'up' then 1 else 0 end as status
from "heartbeat-*"
where monitor.id='yourappserverid'
order by "@timestamp" desc
limit 1
ESQL for selecting version & uptime
SELECT http.cis.build.version as version, http.cis.camel.uptime as uptime
FROM "metricbeat-*"
where agent.type = 'metricbeat'
and fields.metric_id='cis-infohub'
order by "@timestamp" desc
limit 1
ESQL for determining uptime (if you only got millis)
SELECT uptimeDays, FLOOR(uptimeInHours-uptimeDays*24) AS uptimeHours, FLOOR(uptimeInMins-uptimeInHours*60) AS uptimeMins
FROM (
  SELECT FLOOR(system.uptime.duration.ms/1000/60/60/24) AS uptimeDays,
    FLOOR(system.uptime.duration.ms/1000/60/60) AS uptimeInHours,
    FLOOR(system.uptime.duration.ms/1000/60) AS uptimeInMins
  FROM "metricbeat-*"
  WHERE event.dataset = 'system.uptime'
  AND host.name = 'yourhostname'
  ORDER BY "@timestamp" DESC
  LIMIT 1
)
Markdown for displaying title, version & uptime
# Infohub

{{#each rows}}
#### {{version}}
#### Up: {{uptime}}
{{/each}}
[See More](http://link-to-a-detailed-dashoard)
Enjoy !
PS: i also wrote a 3 part blog post about MDC logging with Camel, Spring Boot & ELK. Make sure to check it out!
One thought on “Health dashboard with Kibana Canvas”