This blog is part 1 of a 3-part blog series about Apache Camel, ELK, and (MDC) logging.
Part 1 describes how you can centralize the logging from Spring Boot / Camel apps into Elasticsearch using MDC and filebeat. In part 2 we will aggregate the logging from part 1 with help of logstash into a separate elasticsearch index, grouping messages and making it a bit more readable for managers 😉 Part 3 will use the aggregated logging from part 2 to create watches/alerts to notify you about errors, warnings, etc.
Log files galore
For a large customer based in Rotterdam, we’re building a new platform that will handle all the customer’s integration needs. The platform is based on Spring Boot and we use Apache Camel as our integration Swiss army knife. Actually, there are several Spring Boot applications running at any given time each using SLF4j to log to files.
The #1 question we get asked is:
unsure client
“What happened to my message XYZ? Is it already in system ABC or is it stuck somewhere ?”
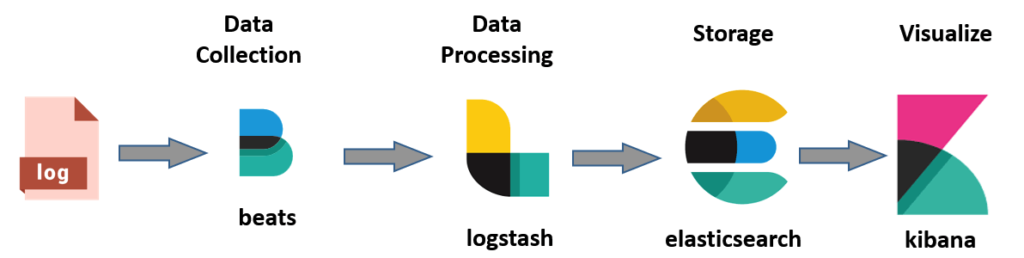
To keep track of the messages flowing through the systems, we like to store all the log data into Elasicsearch. This can be done relatively easily by using Filebeat. Filebeat is a lightweight shipper for log and other data. To make it easy for ourselves (yes I’m lazy, I know) we use a special encoder in Spring’s log configuration. The net.logstash.logback.encoder.LogstashEncoder will output the log data as JSON, so we don’t need any further (GROK) parsing to dissect the log message into separate fields for example. The basic flow will look like this:
Logback-spring.xml
You can use SLF4J / Log4j for logging. In your Spring app you can configure the logging format in an xml file. Default it’s named logback-spring.xml
<?xml version="1.0" encoding="UTF-8"?>
<configuration scan="true" scanPeriod="30 seconds">

    <appender name="Console" class="ch.qos.logback.core.ConsoleAppender">
        <layout class="ch.qos.logback.classic.PatternLayout">
            <Pattern>
                %black(%d{ISO8601}) %highlight(%-5level) [%t][ %blue(%X{camel.breadcrumbId}) ] | %yellow(%C{1.}): %msg%n%throwable
            </Pattern>
        </layout>
    </appender>

   <appender name="FilebeatAppender" class="ch.qos.logback.core.rolling.RollingFileAppender">
        <file>${LOG_PATH}/filebeat/normal-${LOG_FILE}</file>
        <encoder class="net.logstash.logback.encoder.LogstashEncoder">
            <customFields>{"app-name":"app1"}</customFields>
        </encoder>
        <rollingPolicy class="ch.qos.logback.core.rolling.SizeAndTimeBasedRollingPolicy">
            <fileNamePattern>${LOG_PATH}/archived/normal-${LOG_FILE}-%d{yyyy-MM-dd}.%i.gz</fileNamePattern>
            <maxFileSize>100MB</maxFileSize>
            <maxHistory>10</maxHistory>
            <totalSizeCap>1000MB</totalSizeCap>
        </rollingPolicy>
    </appender>

    <root level="info">
        <appender-ref ref="FilebeatAppender"/>
        <appender-ref ref="Console"/>
    </root>

</configuration>
The example above will log to console and to a json file in the specified folder. We also added a custom field ‘app-name’ to later distinguish which app this log came from. The log file will look like this (shortened for readability; and after applying some MDC magic i will discuss later on)
{"@timestamp":"2020-05-24T00:00:00.000Z","@version":"1","message":"Route started","camel.breadcrumbId":"ID-xyz-1590162977230-0-33641","app-name":"app1", "mdc_field1":"test", ...}
....
Filebeat
Filebeat supports a lot of logging ‘modules’ like apache httpd, kafka, activemq, etc. There was no module for our situation, so we added our log paths to the main filebeat.yml file. This will do its work just fine.
filebeat.inputs:

- type: log

  enabled: true

  # Paths that should be crawled and fetched. Glob based paths.
  paths:
    - /opt/acme/app1/log/filebeat/*.log
    - /opt/acme/app2/log/filebeat/*.log

  # json: make it possible for Filebeat to decode logs structured as JSON messages.
  json:
    keys_under_root: true


output.elasticsearch:
   hosts: ["11.22.33.44:9200"]

# output.logstash:
#   hosts: ["11.22.33.44:5044"]
As you can see, multiple logfiles are parsed and ingested directly into Elasticsearch. You can also choose to send it to Logstash for additional filtering / aggregation (as we will do in part 2 of this blog serie).
MDC
You could be all done here without ever using MDC, but then all your logging / useful variables will end up in one big pile in the ‘message’ field of your json log message AND you will need to add everything in every .log() statement every time you want to log. Pff, exhausting and error prone right?
Enter: Mapped Diagnostic Contexts
MDC primarily stores a key-value map of contextual data (strings mapping to strings), and the context map key can be added to your logging format (logging.properties, or other logging configuration), like in the following example (orderId and camel.breadcrumbId are context keys):
%d{HH:mm:ss,SSS} %-5p [%c] %X{camel.breadcrumbId} | %X{orderId} | (%t) %s%E%n
Adding an MDC variable in Java is as simple as :
MDC.put("orderId", "123456789");
Now every log line will have the camel.breadcrumbId and orderId in it!. Note: if you want the camel variables in your logging, you have to enable this in your Spring boot app config like so:
camel.springboot.use-mdc-logging = true
Camel Unit Of Work
Instead of littering your code with MDC.put() statements, you may consider centralizing it in a Camel UOW for example. The Unit Of Work can be configured as a Spring Configuration class, like so:
@Configuration
public class MyLogConfig {
    @Bean
    UnitOfWorkFactory customUnitOfWorkFactory() {
        return exchange -> new MyLogUnitOfWork(exchange);
    }
}
And the actual UOW can extend from the Camel provided MDCUnitOfWork class:
public class MyLogUnitOfWork extends MDCUnitOfWork {

    public MyLogUnitOfWork(Exchange exchange) {
        super(exchange);
// do some magic here with exchange headers and/or exchange properties
// like putting all properties starting with "yadayada_" into MDC. This way you don't have to do MDC.put(...) all the time. Just an idea ;-)
}
Now, if Spring can find your MyLogConfig class, then every camel route you create will use your (MDC) Unit of work class. Nice he!?
Proceed to part 2
One thought on “MDC logging with Camel, Spring Boot & ELK”