This blog is part 2 of a 3-part blog series about Apache Camel, ELK, and (MDC) logging.
Part 1 described how you can centralize the logging from Spring Boot / Camel apps into Elasticsearch using MDC and filebeat. In part 2 we will aggregate the logging from part 1 with help of logstash into a separate elasticsearch index, grouping messages and making it a bit more readable for managers 😉 Part 3 will use the aggregated logging from part 2 to create watches/alerts to notify you about errors, warnings, etc.
Yes yes, very nice this centralized logging, but now I see 20+ messages in Kibana of my integration scenario.
Our IT manager
That’s too much and too technical for me! I just want one line saying ‘Did it succeed or not and where was it delivered’
So now all the logging of our apps is centralized in elasticsearch (see Part 1) we can do all sorts of nice things with it. Search it (duh!), create dashboards, but also: keep our manager and functional support people happy by creating some sort of ‘summary’ of all logs of a certain integration scenario.
As an example, consider a simple integration scenario “At the beginning of each month, download exchange rates from the Myanmar bank and put them on a file share / queue / whatever”. This scenario can contain multiple steps like:
- A quartz timer that fires when it’s time to fetch the rates
- Download the rates from the Myanmar website
- Transform the raw format (JSON, HTML, etc) to our internal format (CDM: canonical data model)
- Sometimes: aggregate this with another source, enrich the data, split into multiple messages, etc
- Put the CDM message on the file share/queue / whatever
All this is nicely logged into elasticsearch, grouped together on camel’s breadcrumbId but as you can see the number of messages of this and more complex integration scenario’s can quickly become overwhelming.
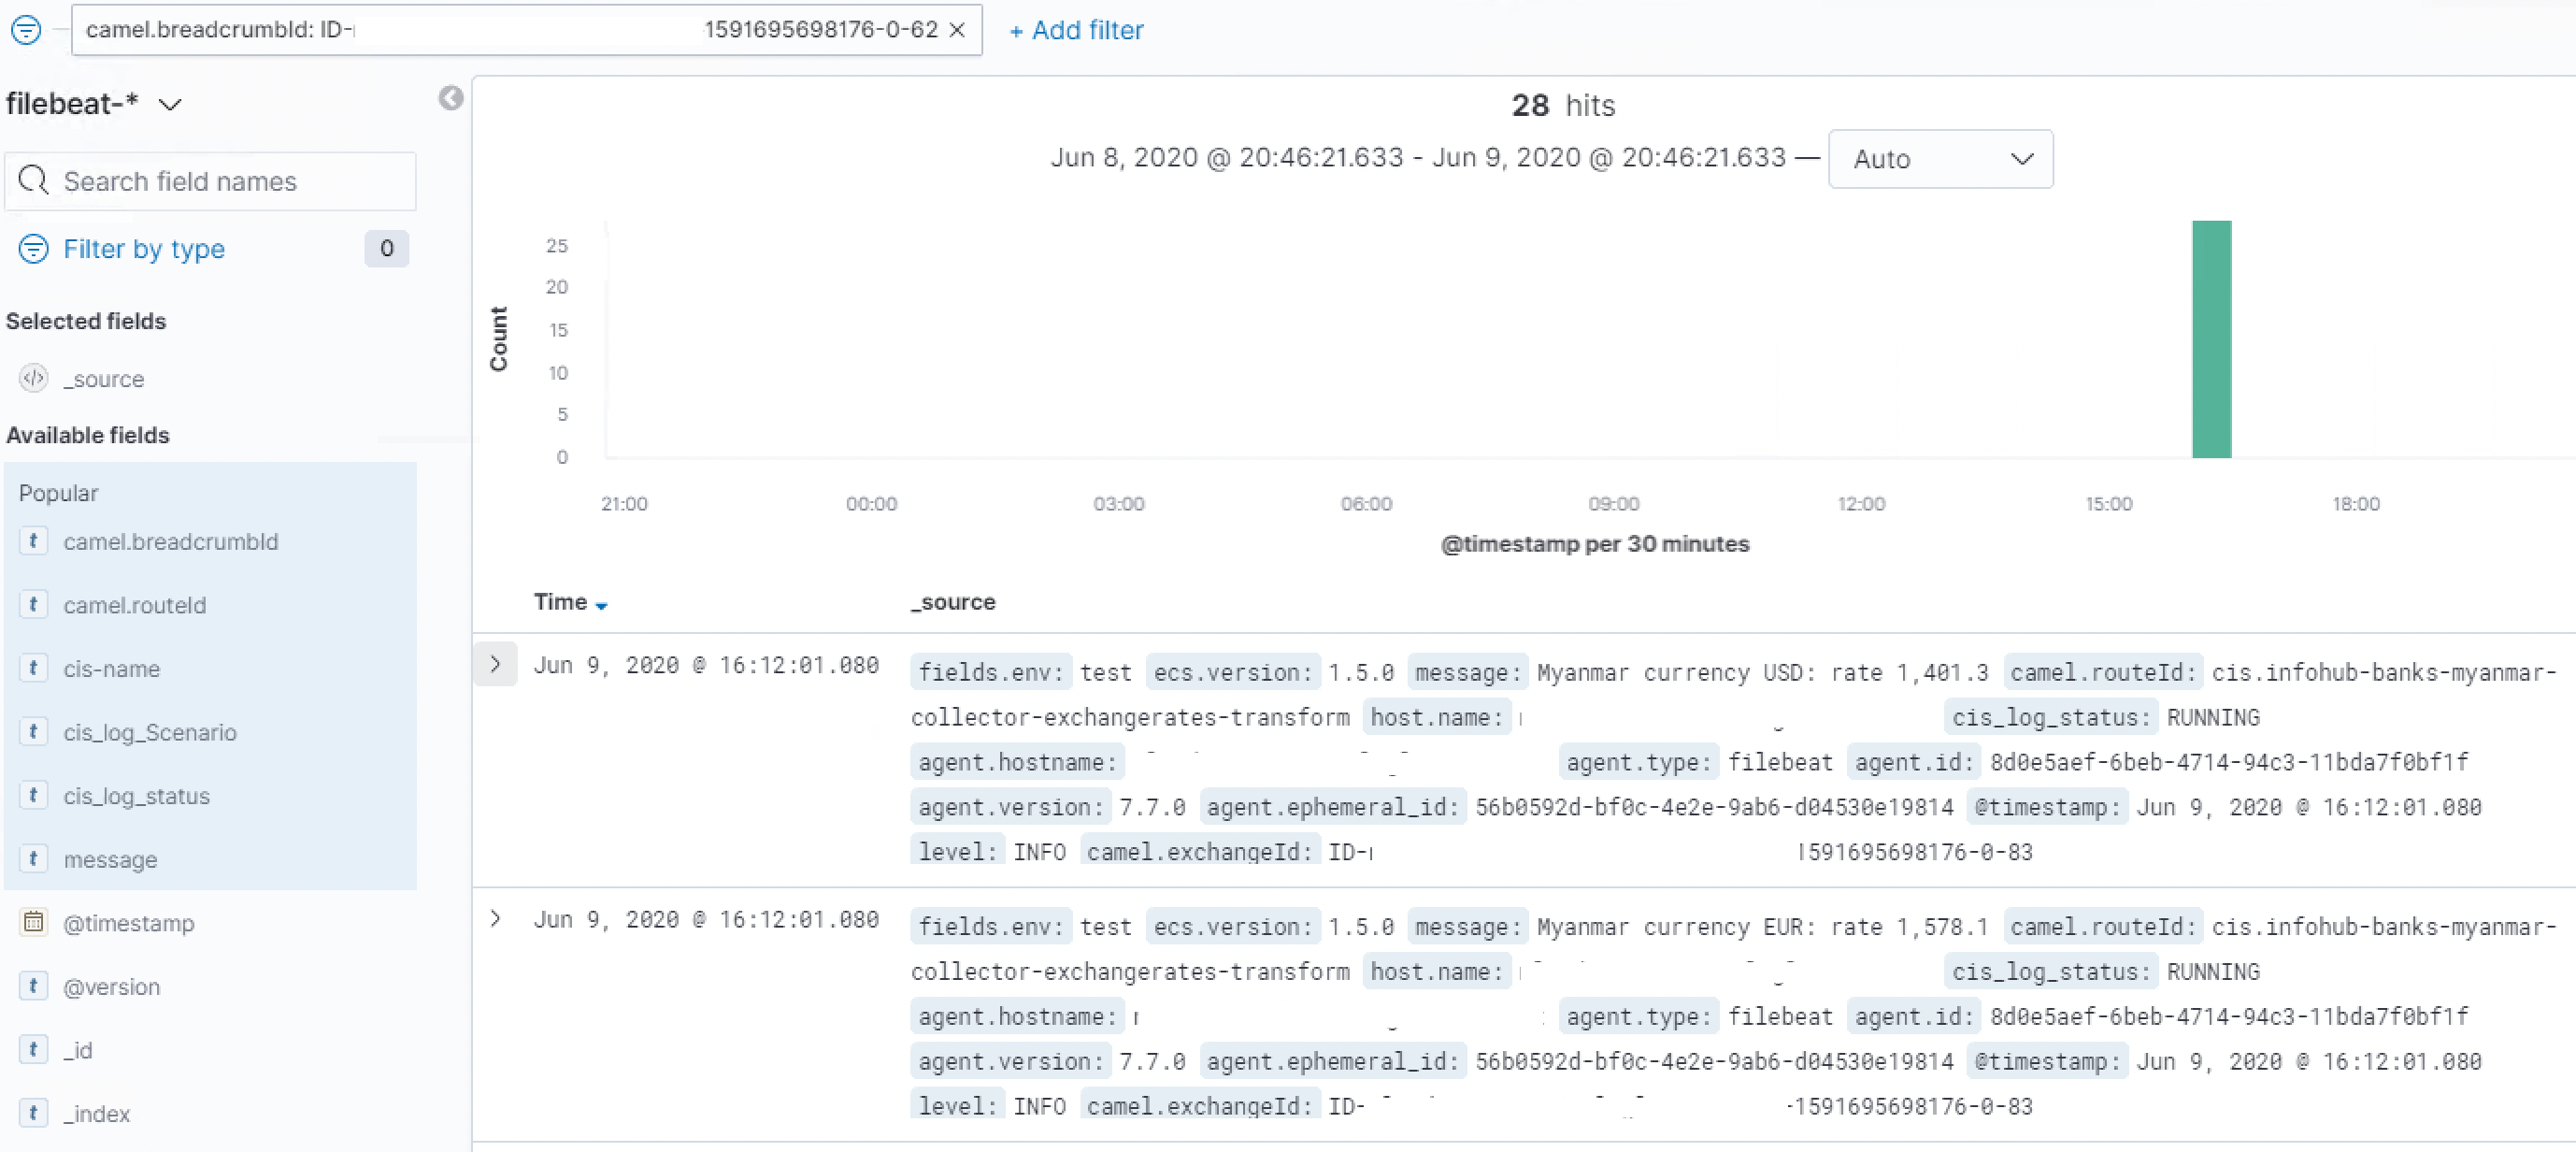
You can use the power of the Elasticsearch API’s to do a complex search, with filters, fuzzy matching, some aggregation, etc but this all seemed too complicated for my taste.
Why not creating a 2nd index in elasticsearch containing the ‘summary’, leaving the original index intact of course.
Enter: logstash (aggregation filter)
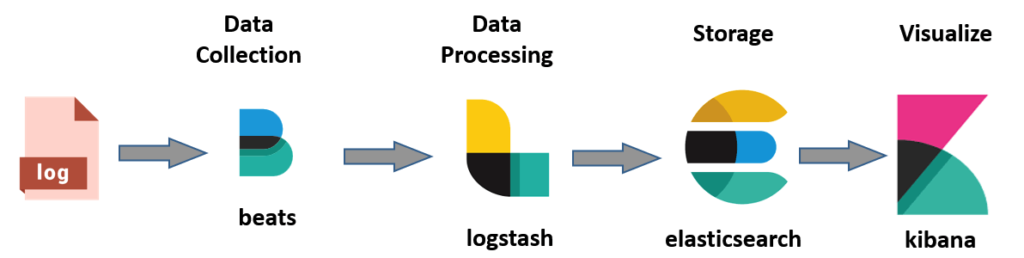
Remember, the setup from part 1? Now we actually gonna use logstash to do the aggregation for us.
We use logstash to aggregate the messages of one breadcrumbId
First, we have to tell filebeat to send it’s output to logstash instead of elasticsearch.
filebeat.inputs:

- type: log

  enabled: true

  # Paths that should be crawled and fetched. Glob based paths.
  paths:
    - /opt/acme/app1/log/filebeat/*.log
    - /opt/acme/app2/log/filebeat/*.log

  # json: make it possible for Filebeat to decode logs structured as JSON messages.
  json:
    keys_under_root: true


#output.elasticsearch:
#   hosts: ["11.22.33.44:9200"]

output.logstash:
  hosts: ["11.22.33.44:5044"]
Logstash can be configured in so-called ‘pipelines’. A pipeline is a simple (Ruby-like) description of the input, an optional filter, and the output. The 3 sections each can make use of the many plugins available. See for example the input plugins, filter plugins, and output plugins. We’re focussing on the aggregate filter plugin. The pipeline can be dropped in the /etc/logstash/conf.d folder (assuming you are on an *nix box)
This is the complete pipeline for our aggregation. Explanation below!
input {
    beats {
        port => 5044
    }
}

filter {
    # The following line will create 1 additional copy of each document
    # Each copy will automatically have a "type" field added corresponding to the name given in the array.
    clone {
        clones => [ 'clone_for_aggregation' ]
    }

    if [type] == 'clone_for_aggregation' {
        aggregate {
            task_id => "%{camel.breadcrumbId}"
            code => "
                map['Name'] ||= event.get('cis-name')
                map['SourceSystem'] ||= event.get('cis_log_SourceSystem')
                map['SourceSystemReference'] ||= event.get('cis_log_SourceSystemReference')
                map['Scenario'] ||= event.get('cis_log_Scenario')
                map['TargetSystem'] ||= event.get('cis_log_TargetSystem')
                map['TargetSystemReference'] ||= event.get('cis_log_TargetSystemReference')
                map['Status'] ||= 'UNKNOWN'
                if event.get('cis_log_status') =~ /COMPLETED/
                    map['Status'] = 'COMPLETED'
                elsif event.get('cis_log_status') =~ /ERROR/
                    map['Status'] = 'ERROR'
                end
                "
            push_map_as_event_on_timeout => true
            timeout_task_id_field => "camel.breadcrumbId"
            timeout => 120 # 2 minutes
            timeout_code => "event.set('[@metadata][type]', 'aggregated_event')"
        }
    }
}

output {
    if [@metadata][type] == 'aggregated_event' {
        elasticsearch {
            hosts => ["http://localhost:9200"]
            index => "aggregated-filebeat-%{+YYYY.MM}"
        }
    } else if [type] != 'clone_for_aggregation' {
        elasticsearch {
            hosts => ["http://localhost:9200"]
            index => "filebeat-%{+YYYY.MM}"
        }
    }
}
Explanation:
- Line 1-5: tells logstash to listen on port 5044, for events send by filebeat
- Line 10-12: I want the original event to go to elasticsearch just as before. I make a clone of the event with the clone plugin. This will copy the even and the cloned copy will have a type field with the value ‘clone_for_aggregation’. This helps us later to discriminate between type of events.
- Line 14: only apply it to the cloned event.
- Line 15-16: use the aggregate plugin, and aggregate on the field ‘camel.breadcrumbId’. Effectively saying: group all messages with the same breadcrumbId together.
- Line 17-30: Ruby-ish code that runs for every event. We map the fields from the input to friendlier field names. For example, Line 18 says: get the cis-name value and put in into a new field called ‘Name’. Because of the ‘||=’ syntax, it only happens when Name is not already initialized.
- Line 24: initialize the Status to ‘UNKNOWN’. It could happen that, because of an exception/network problems/ etc, the final message never comes in in time. Than the Status stays ‘UNKNOWN’
- Line 31-34: when the timeout occurs (2 minutes) the new event is pushed. This is done because we could never be sure the last success or error message is received.
- Line 39-51: the aggregated event will be send to another index as the original event.
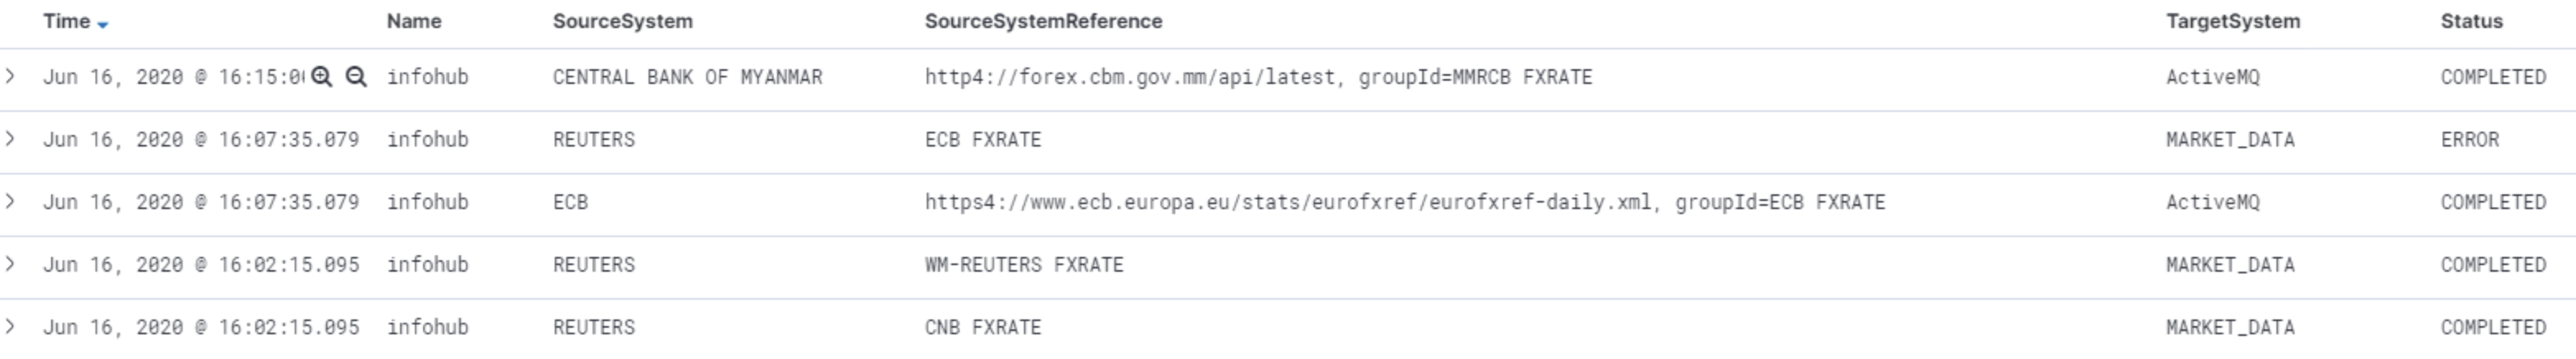
After a minute or 2 the aggregated events will start to trickle through. You will now see a much cleaner log, one-line per scenario like this:
Pro tip: also see the article of my Luminis colleague Jettro Coenradie on how to create a robust Logstash configuration: https://sharing.luminis.eu/blog/robust-logstash-configuration/
Nice he!? In the last part of this blog series we will use this aggregated logging to set some alarms. Proceed to part 3
One thought on “MDC Logging with Camel, Spring boot & ELK (part 2)”